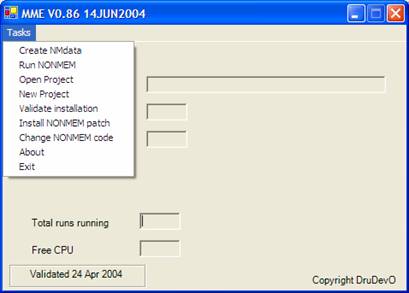
MME
MME will make PK/PD modeling and
NONMEM much easier but since modeling itself is not easy, MME has all the tools
to make coaching less experienced persons much easier and makes it easier to keep
the quality at a high level with a minimum of expert input. If you have no
experience you can still take profit of NONMEM by using the standard libraries
for model exploration and covariate building.
You also do not have to worry
with learning/teaching things around NONMEM like programming in Excel, Splus or Linux or maintaining/validating those own written
routines. All you basically need is covered by MME itself.
The program is up to today’s
demands for regulatory acceptance and thus offers integrated software and
installation validation, complete audit trail and is GCP and 21CFR11 compliant.
The program takes optimal use of
the current hyperthreading possibilities of the new
Intel processors.
You can use MME instead of
compartmental curve fitting programs using standard (user changeable) PK and
PK/PD libraries.
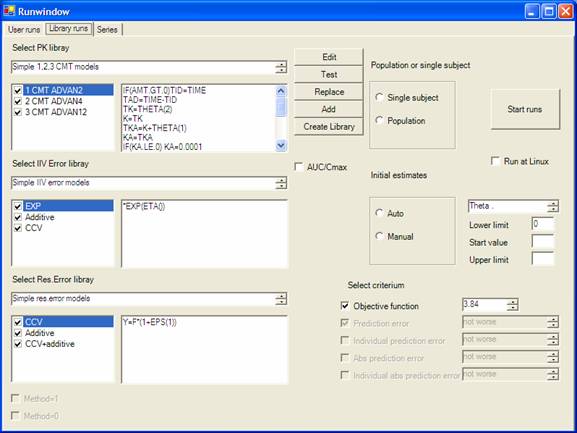
Have you ever seen evaluation
results stating that k43=0.134*(BSA-1.7)+…. and wonder
what this clinically means? MME will give you more clearly readable results. It
will calculate AUC, Cmax and t1/2 (whatever they clinically
mean is up to each user to decide!) which are easily compared for each
covariate in the model. Comparison can now also be made against results from
other PK studies.
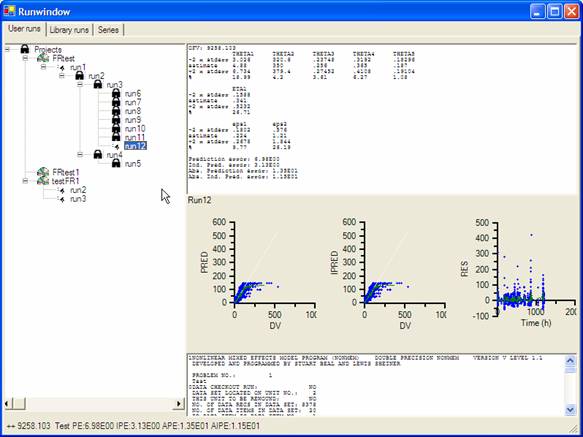
The program allows running a
large number of NONMEM runs at the same time. Each run has its own window and
can be controlled independently.
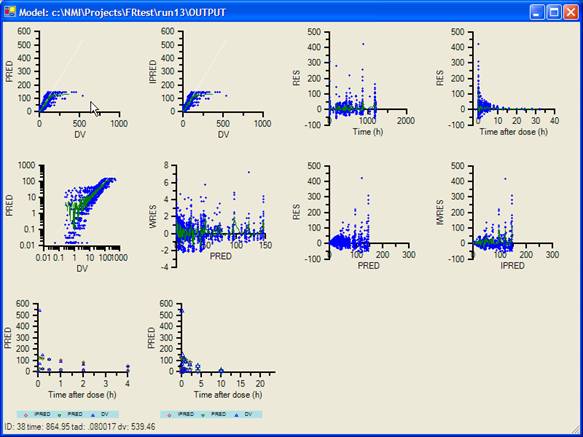
After each run descriptive
statistics and graphics are automatically created.
Since all graphics can be
performed by the program, the 20 items input restriction for NONMEM only
applies for those items truly needed in your model. No other programs like
Excel, Splus or SAS are needed. For extended
capabilities interfacing to Splus user written
routines is possible. MME graphics are interactive. You can magnify graphics or
looking at the data behind each individual point. All graphics are
automatically saved to disk at a higher resolution so they can be included in a
document or presentation.
All runs (whether manually or
automatically generated) are saved in our tree-like summary. This shows you the
logic and thinking behind the model building process. When scrolling over a run
all relevant information about that run is shown.